Brand Growth OS
Built to replace scattered calendars, chat-thread approvals and disconnected ad dashboards with a single workspace for planning, tracking and reporting client growth.
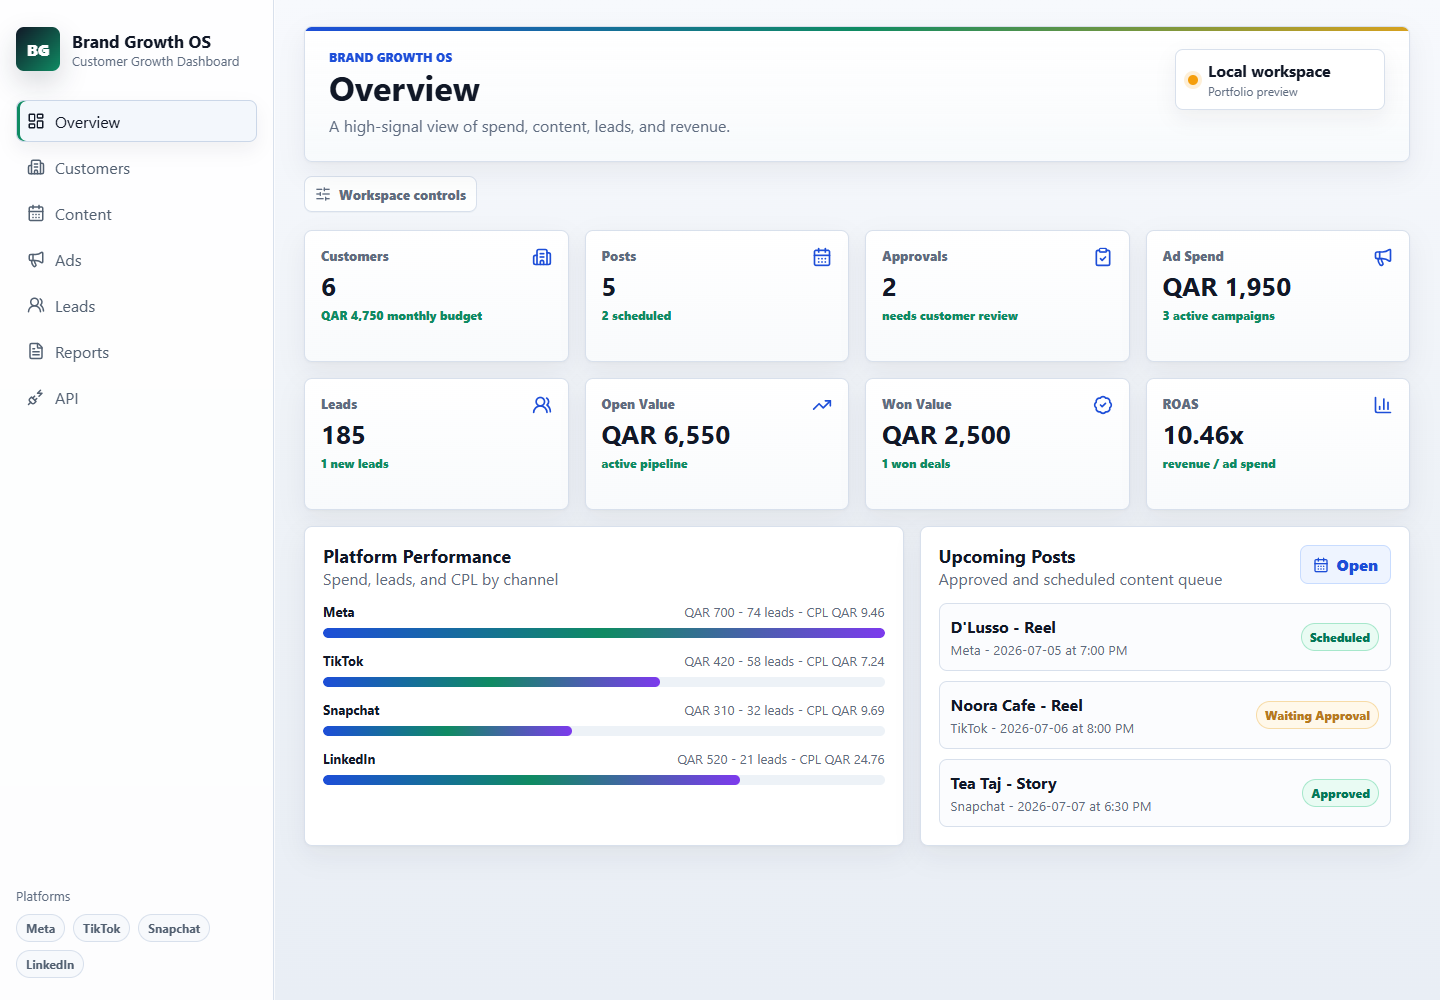
The Overview — spend, content, leads and revenue in one high-signal view
Growth work was living in a dozen places at once.
A social account manager runs several client brands at once — each with its own calendar, its own budget, and its own reporting cadence. In practice that meant a spreadsheet for planning, a chat thread for approvals, four platform dashboards for spend, a separate tracker for leads, and a deck rebuilt by hand at the end of every month.
Nothing connected. A campaign's ad spend sat in one tool, the leads it produced in another, and the revenue it closed nowhere at all — so the single question a client always asks, "is this working?", took hours to answer and rarely with confidence.
The operation didn't need another dashboard. It needed one place where planning, approvals, paid media, leads and reporting shared the same source of truth — and where daily activity was already tied to the commercial outcome.
One path, from idea to insight.
Every piece of content moves through the same six stages — the system carries it the whole way.
Six connected surfaces, one operating system.
Content Planning
Posts, captions, assets and dates for every client, laid out on one calendar.
Approvals
A clear queue where clients review and sign off before anything goes live.
Ads Tracking
Spend, leads and cost-per-lead by channel, pulled into a single comparison.
Leads & CRM
Every enquiry with its next action, owner and won value — activity tied to revenue.
Creative Testing
Hooks and creatives tracked against results, so winning work is easy to repeat.
Monthly Reports
A client-ready performance spread the workspace assembles on its own.
A few screens, and why they matter.
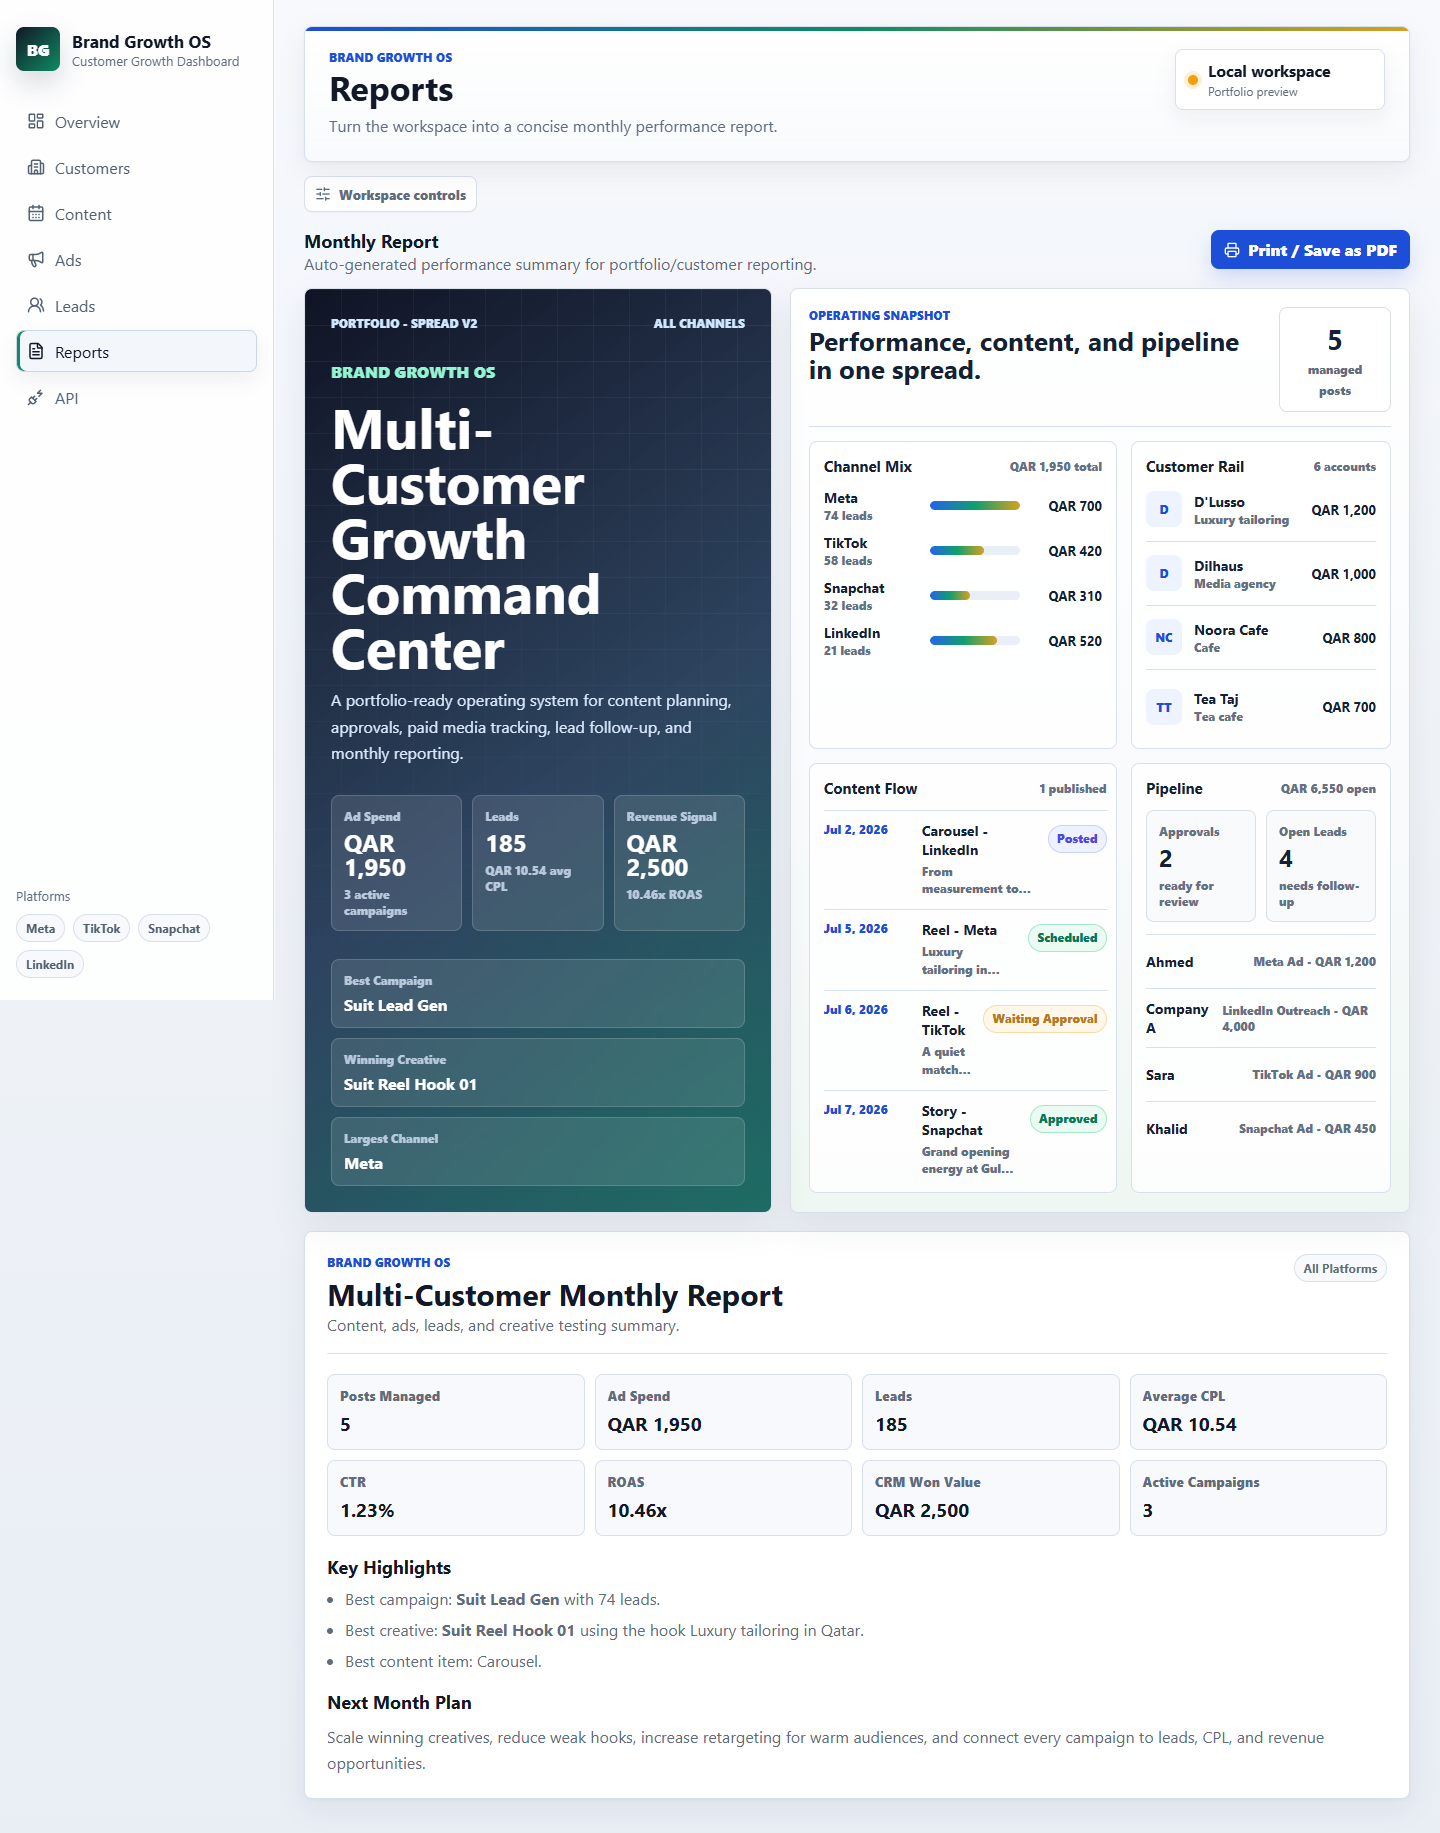
The month compiles itself.
What used to be an evening of copy-pasting into a deck is now a client-ready spread — channel mix, content flow and pipeline in one view, ready to send.
The operating picture travels.
Between meetings and shoots, the whole workspace collapses to a phone — approvals to clear and the scheduled queue stay one tap away, so nothing waits for a desk.

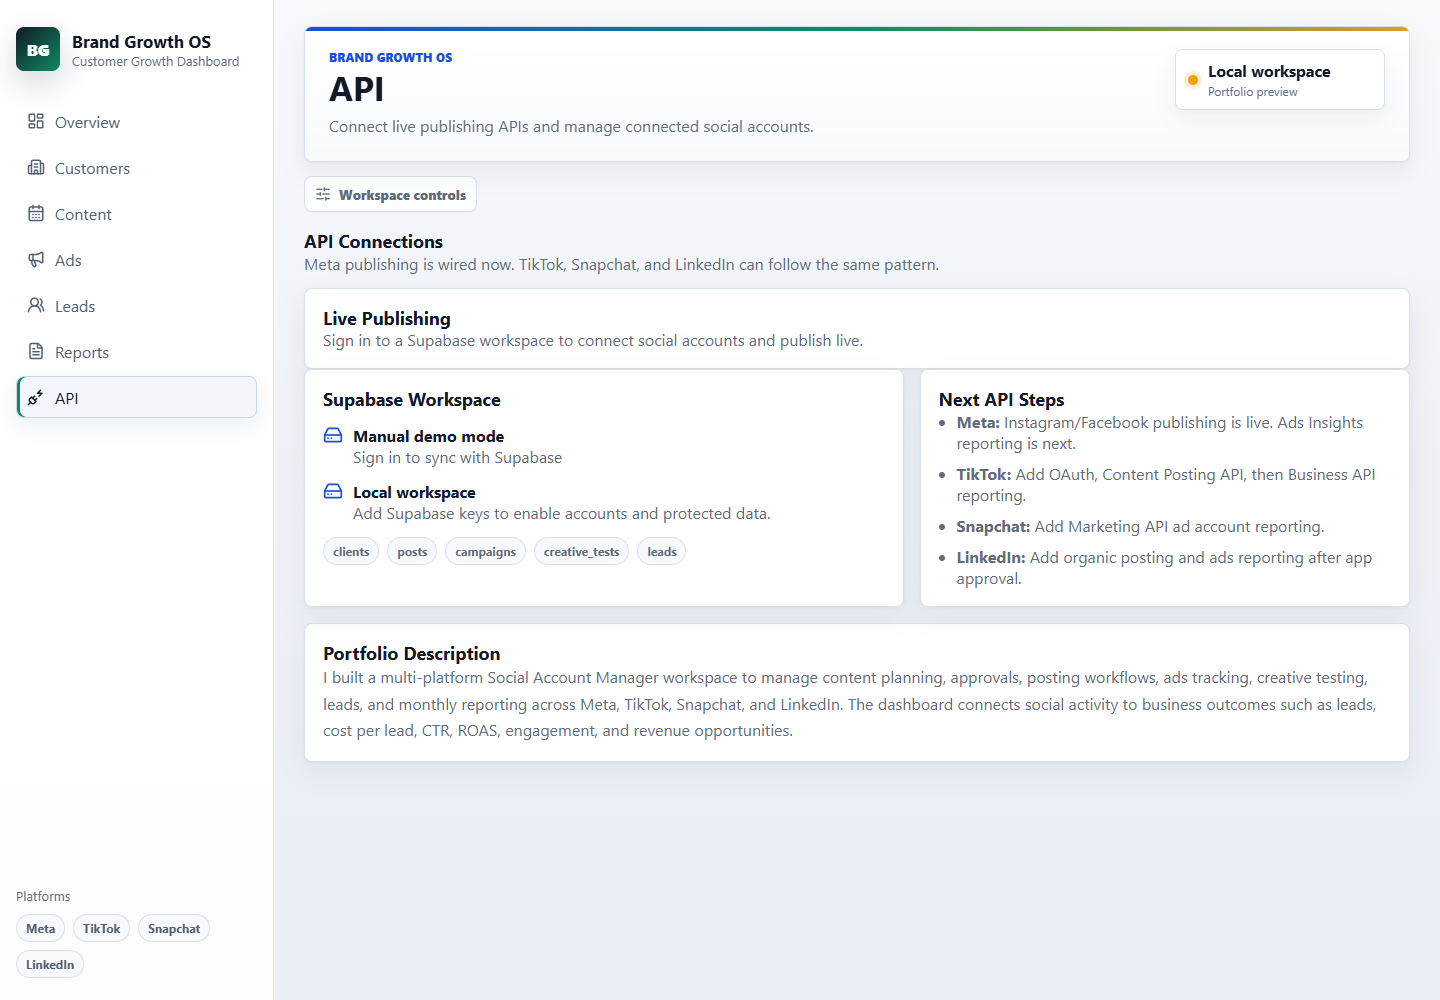
Approved work becomes posted work.
Publishing connects straight to the platforms, so the queue doesn't need a second tool to go live — Meta is wired now, with the same pattern ready for TikTok, Snapchat and LinkedIn.
End to end, concept to working product.
What actually changed day to day.
One record, not five
Planning, spend, leads and results share a source, so duplicate manual entry across tools disappears.
Reporting in minutes
The monthly spread assembles itself, replacing hours of rebuilding a deck by hand.
Activity tied to revenue
Every campaign links to the leads and won value it produced, so "is this working?" has an answer.
Visibility across clients
Several brands sit in one view, so nothing slips between a full roster of accounts.
Brand Growth OS exists because good social work kept getting judged by the wrong artefacts — the calendar, the chat, the screenshot — instead of the outcome it drove.
Building it end to end taught me how much of an operator's day is spent moving the same information between tools, and how much calmer the work feels once that friction is designed away. The clearest lesson was to model the data first: once clients, posts, campaigns and leads shared one structure, the interface almost fell out of it.
From here it grows toward live publishing across every platform, richer creative-testing signals, and automated insights that don't just report the month but suggest the next one.